USING AN "ACTIVE" USB EXTENSION CABLE
Normally, a Windows P.C. connects to the RigExpert antenna analyzer via a USB-2 cable. The USB-2 spec supports cables (at full speed) up to about 5 meters in length - much too short for using to measure an antenna at its feedpoint when it is typically 10m/30ft. in the air, or higher.
I had heard of USB extension cables but never given it much thought. As it turns out, there are "Active" USB Extension Cables that support up to 15m or even longer lengths. For my purposes, 15m is sufficient. I ordered one and promptly tried it:

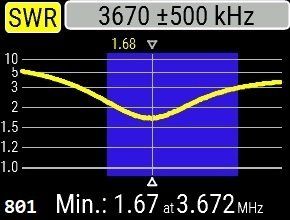
I first scanned each configuration with a 1 MHz scan, centered on 3.670 MHz. This wide scan gives us a good view of the SWR curve across the band. However, it doesn't show as much detail as the "bandspread" scan.
Screenshot from the analyzer ->
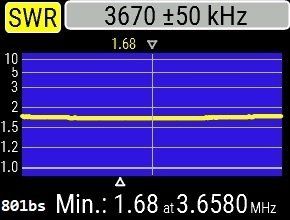
Next, I made "bandspread" scan, scanning 100 kHz, centered on 3.670 MHz. This shows data in half-kHz increments.
Curious, SWRmin occurred 14 kHz lower with this scan than with the wider scan on both methods of measuring. ->


Measurements initiated from the computer using AntScope-2 do no display data on the analyzer. Thus no screenshot from the analyzer was possible. The parameters of the minimum SWR were determined manually from the AntScope graph:
1.68 at 3.673 MHz
Again there was no data shown on the analyzer screen, so no screenshot was possible. The parameters for SWRmin were extracted manually from the AntScope graph:
1.68 at 3.6584 MHz
Here are the full AntScope scans of the two methods of measuring:

Note: No attachment to the computer.

Note: The computer was running on its battery.
Measuring with a "Calibrated" (de-embedded) Coax Extension
For this test, ANT' was remeasured with a floating analyzer, this time with a 500 Hz scan, and the results were compared to measurements taken at the end of an 18m long RG-174 coax.
FLOATING ANALYZER

No Extension Coax
FLOATING + 18m RG-174

Calibration not Enabled
FLOATING + 18m RG-174 CAL

Calibration Enabled
As can be seen, adding 18 meters (59 ft.) of coax between ANT' and the analyzer skewed the results considerably. The SWR dropped by 0.1, and the frequency of minimum SWR (SWRmin) rose 45 kHz.
With the calibration (CAL) adjustment parameters enabled, the curve more closely resembled the measurements taken directly at ANT'. The level of SWR was 0.04 higher, the frequency of SWRmin was just 4 kHz lower.
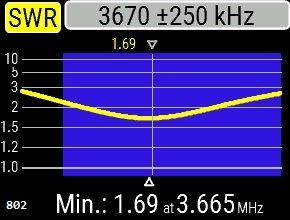
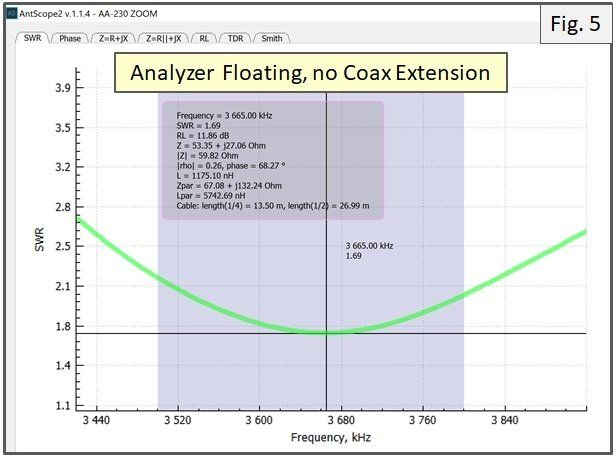
Comparison of the AntScope graphs of the direct measurement with the CAL measurement:


Fig. 5 shows the SWR curve with no extension coax attached. Fig.6 shows how an 18m extension coax changes the level of SWR and the frequency of SWRmin.
Unfortunately, AntScope cannot import calibrated data from the analyzer. Even though data was measured with CAL enabled, native data (CAL disabled) is displayed when you import the data from the analyser.
<- The screenshot from the analyzer is the only way I can display the measurement. Note that it is very close, but not quite the same as Fig.5.
From the two methods of remote measuring used in the measurements shown on this page, although the calibrated (de-embedded) coax is very close to mirroring the measurement taken directly at ANT', it is not as accurate as using the Active USB Extension cable.
